
Total value of six accepted jobs in the simulated scenario
Connected business-management system / AK Randall Digital
Most relevant if: important work still depends on memory, inboxes, and workarounds
From scattered business activity to one place to run it.
The business had separate tools for new leads, pricing, proposals, projects, invoices, and reports. The problem was what happened between them. This command center keeps the customer record, next action, financial context, and delivery status connected.
Working business-management system · Fictional demonstration clearly labeled · Configured with your approved business data
- Capture
- Qualify
- Price
- Deliver
- Learn
Simulated monthly value of ongoing, repeat work currently being delivered
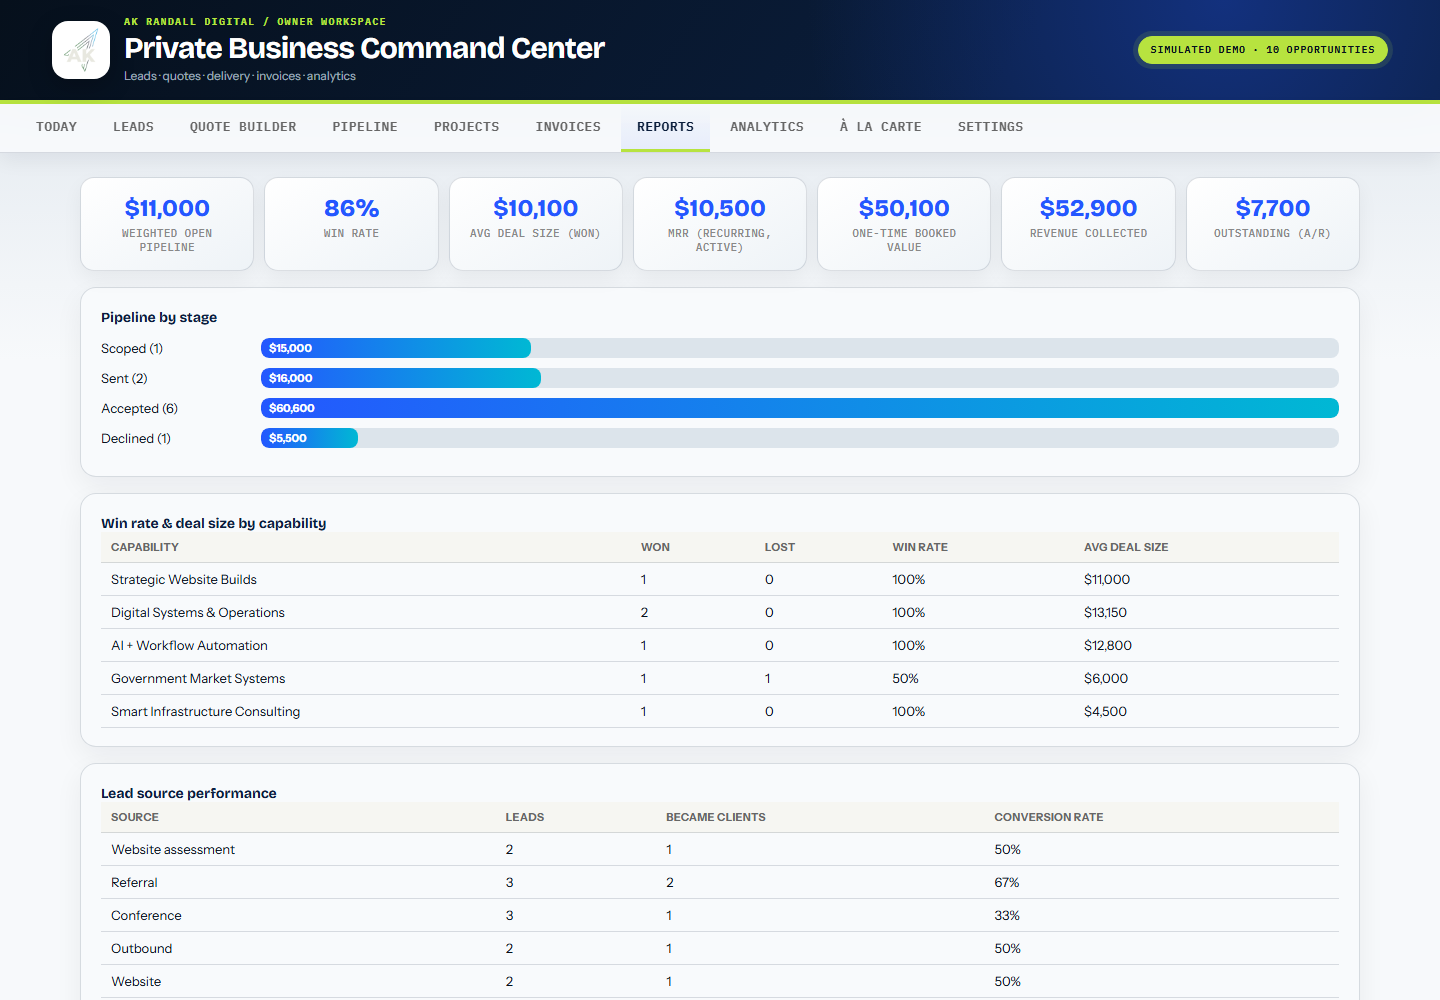
Six accepted opportunities out of seven opportunities with a final decision
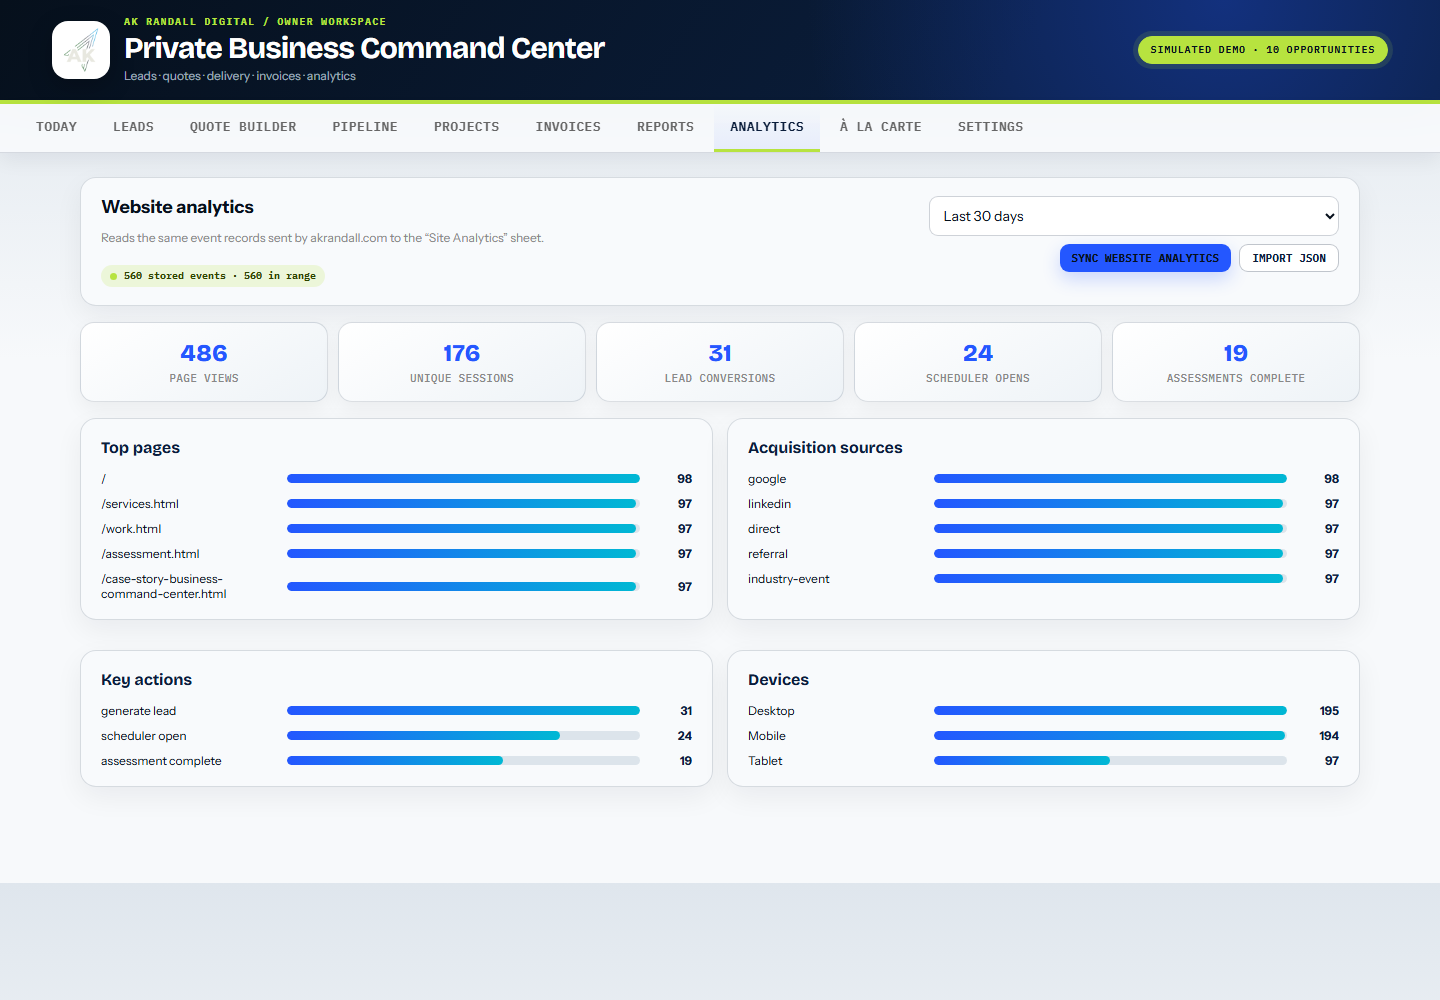
Simulated website visits during the most recent 28 days
Demonstration scenario: every company, contact, opportunity, transaction, and performance metric above is fictional. The scenario is intentionally strong so buyers can inspect how the system communicates a healthy operation—not as a claim about AKRD or any client.
Plain-language guide
What the business terms mean.
The demonstration keeps the full operating detail, while these definitions make the numbers and screens easier to evaluate without sales or operations experience.
- Command center
- One owner workspace that connects sales, project delivery, invoices, and reporting.
- Handoff
- The moment a customer, job, or piece of information moves from one step, person, or tool to the next.
- Booked value
- The total price of accepted work. It is not the same as cash already collected.
- Monthly recurring revenue
- The monthly value of ongoing work expected to repeat while the agreement remains active.
- Win rate
- Accepted opportunities divided by all opportunities that received a final yes-or-no decision.
- Website session
- One visit to the website. The same person can create more than one session.
See the system move
The screens show the work. The connections explain why it matters.
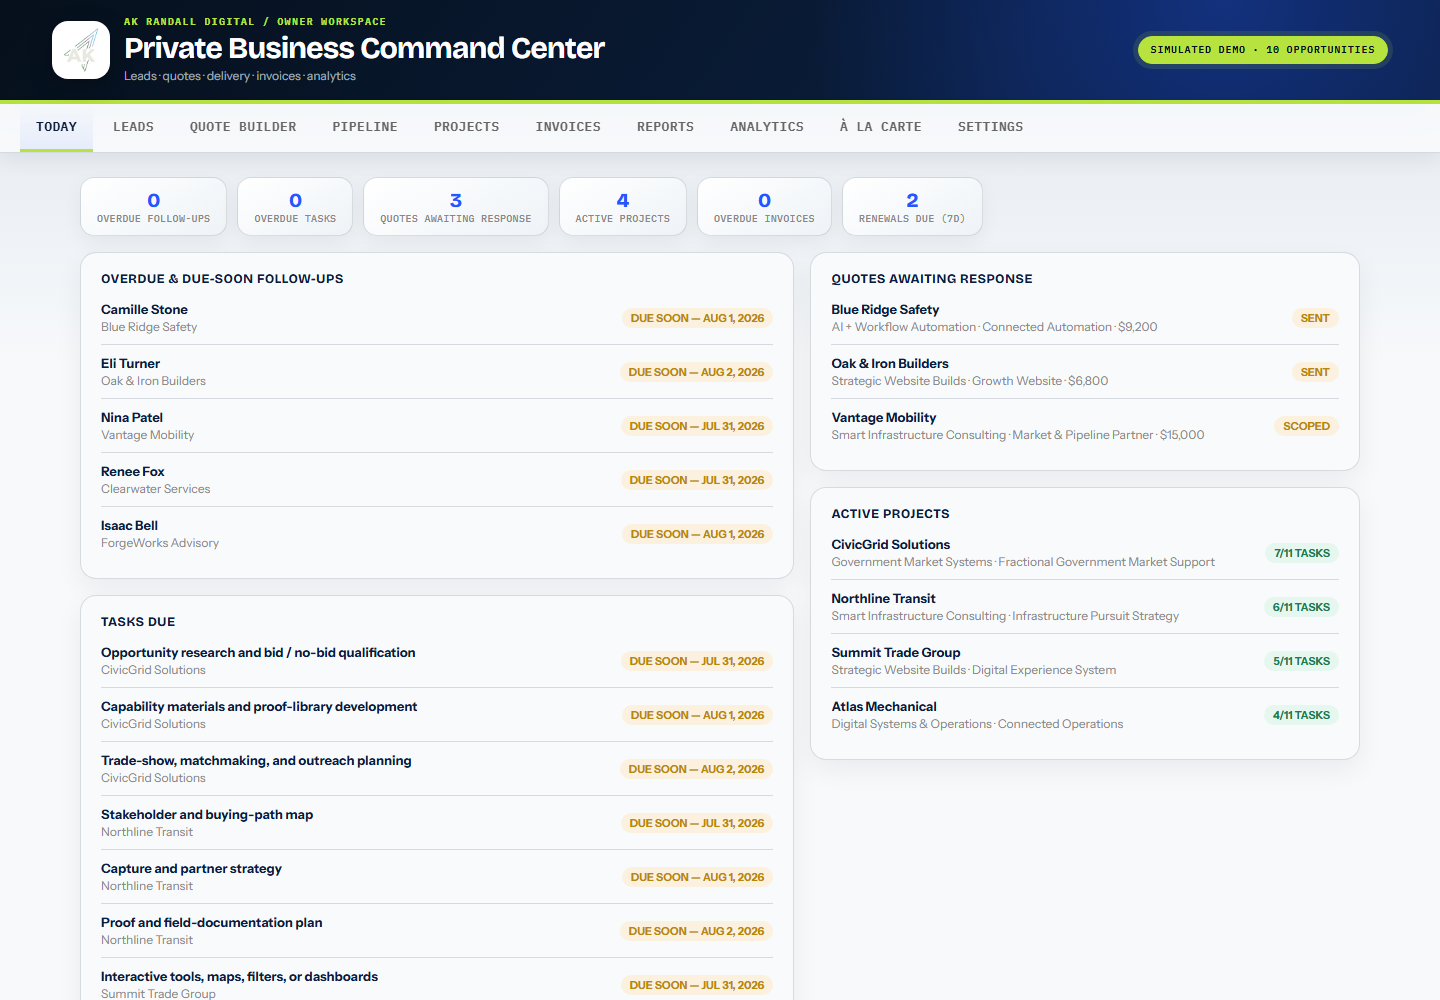
The film follows a clearly labeled, high-performing fictional business from its daily priorities through new leads, pricing, potential sales, project delivery, invoices, reports, and website activity.
The real problem
Useful tools can still create a broken operating path.
A form can capture a potential customer. A sheet can store the contact. A pricing tool can calculate a quote. A calendar can hold the next meeting. None of those pieces guarantees that the full customer story survives the handoff—the moment information moves from one step or tool to the next.
The cost of a disconnected system is rarely one dramatic failure. It is the accumulation of small delays, repeated entry, missing context, and decisions made from partial information.
The connected operating path
Build around the decisions the business has to make next.
The system does not make decisions for the owner. It puts the current status, history, financial context, and next action in one place so the owner can decide with less searching and guesswork.
- CAPTURE
Bring the signal in
Website leads and assessment context can enter the owner workspace without becoming another isolated inbox.
- QUALIFY
Decide what deserves pursuit
The source, notes, next follow-up, and current stage—where the opportunity sits in the sales process—create one visible record of the next move.
- PRICE
Protect scope and expected profit
Service levels, optional add-ons, available time, delivery cost, and quote totals connect the price to the work required to deliver it.
- DELIVER
Carry the promise forward
An accepted quote can become a project, tasks, invoice, and renewal path without rebuilding the story from scratch.
- LEARN
See what the system is producing
Reports and website analytics create a foundation for better questions about demand, conversion, workload, and follow-through.
Inside the working system
Every screen answers a different operating question.
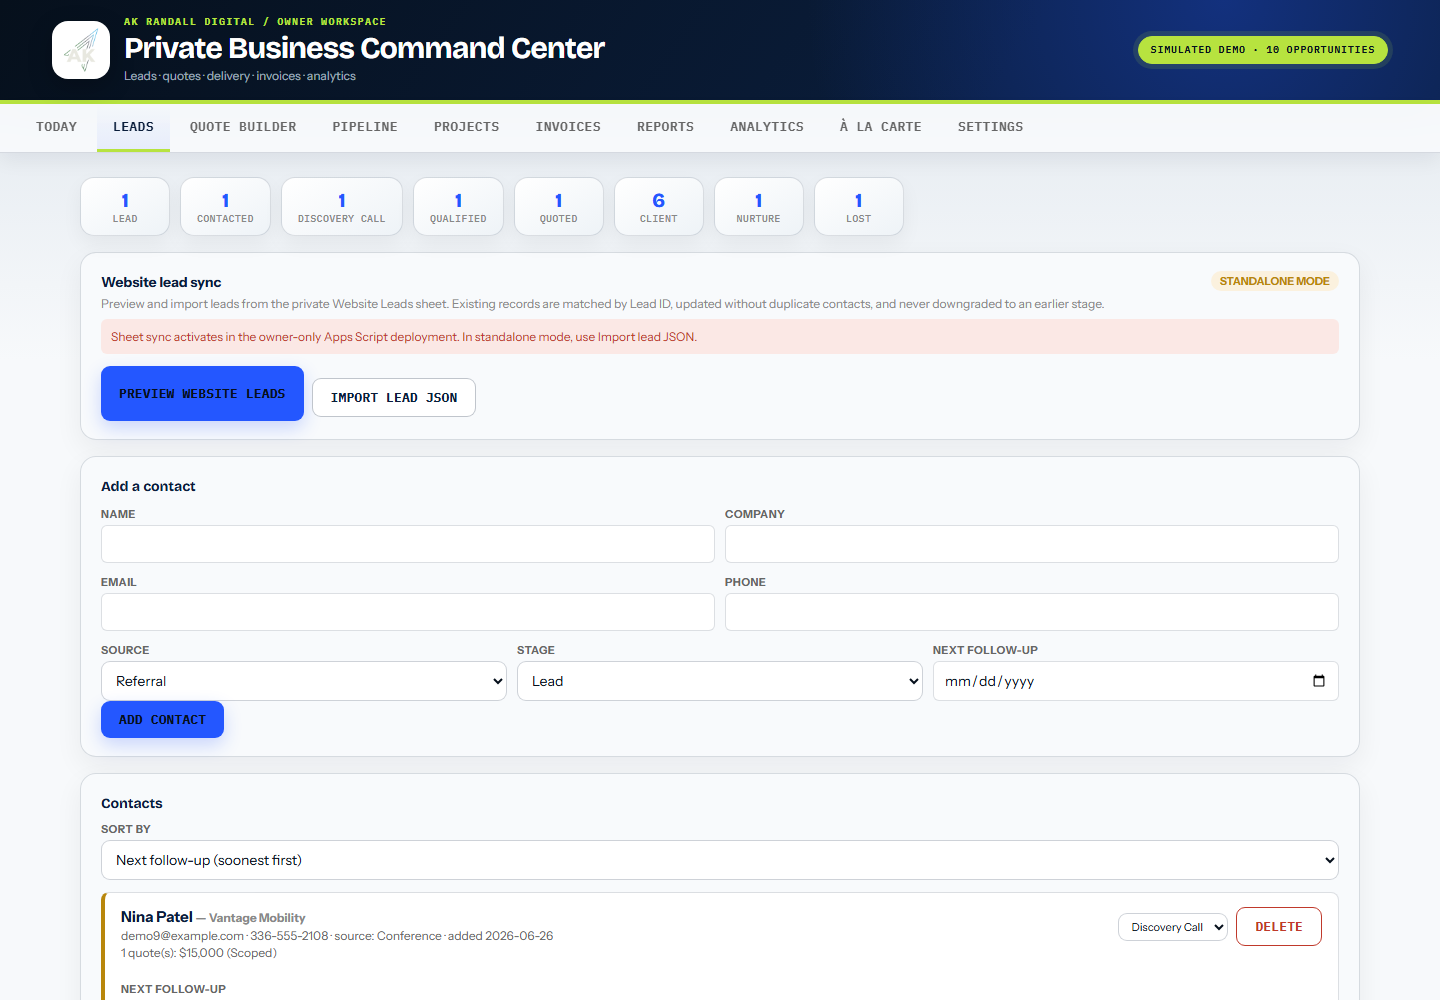
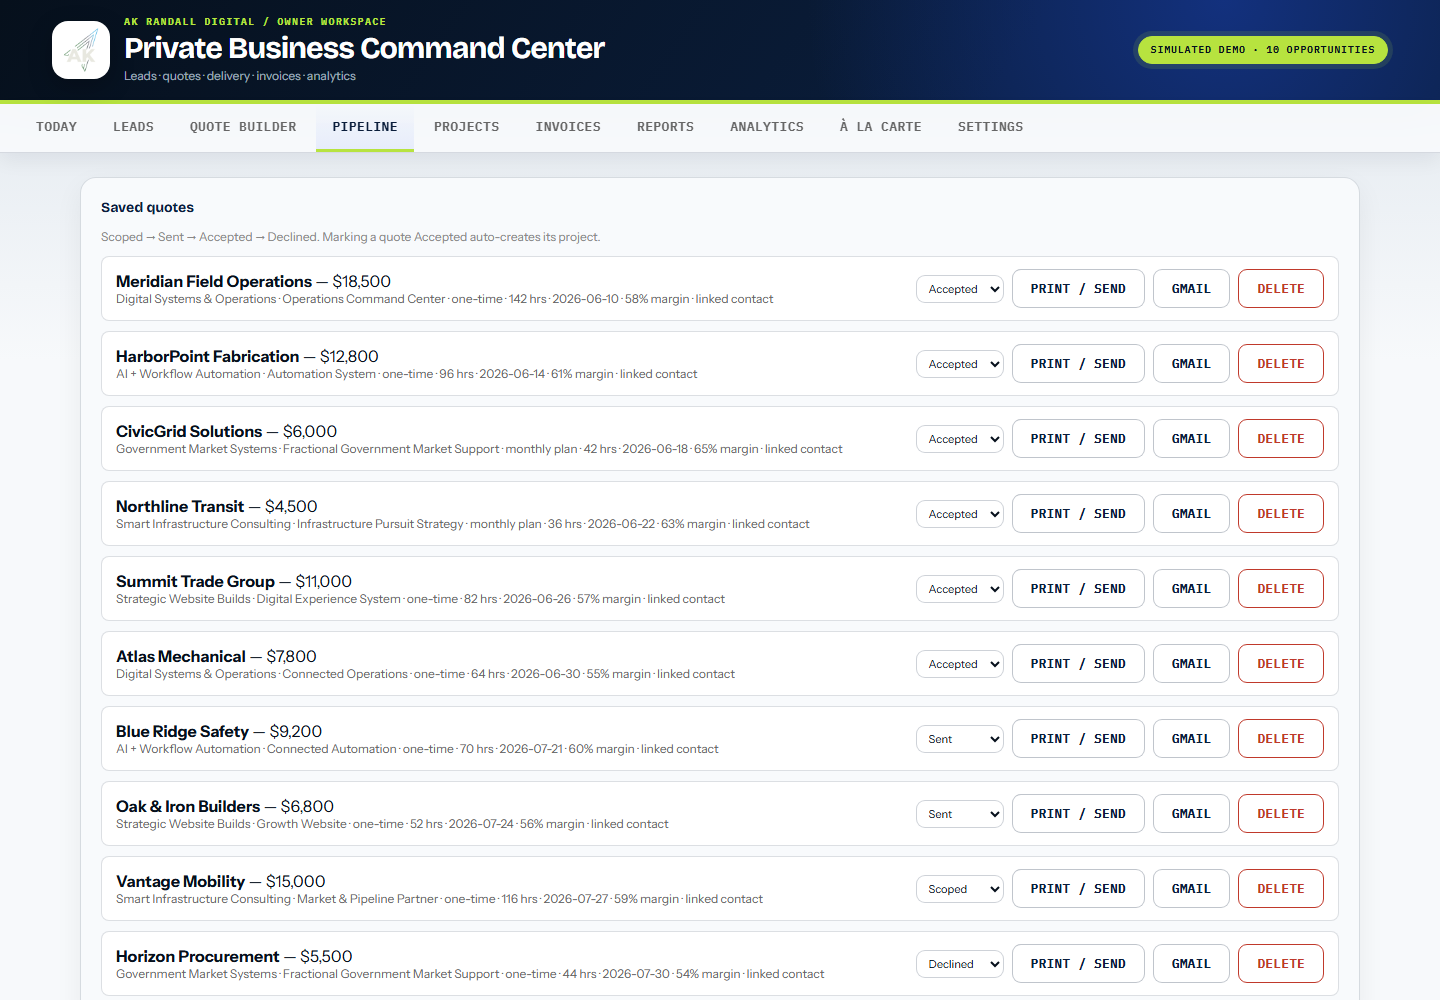
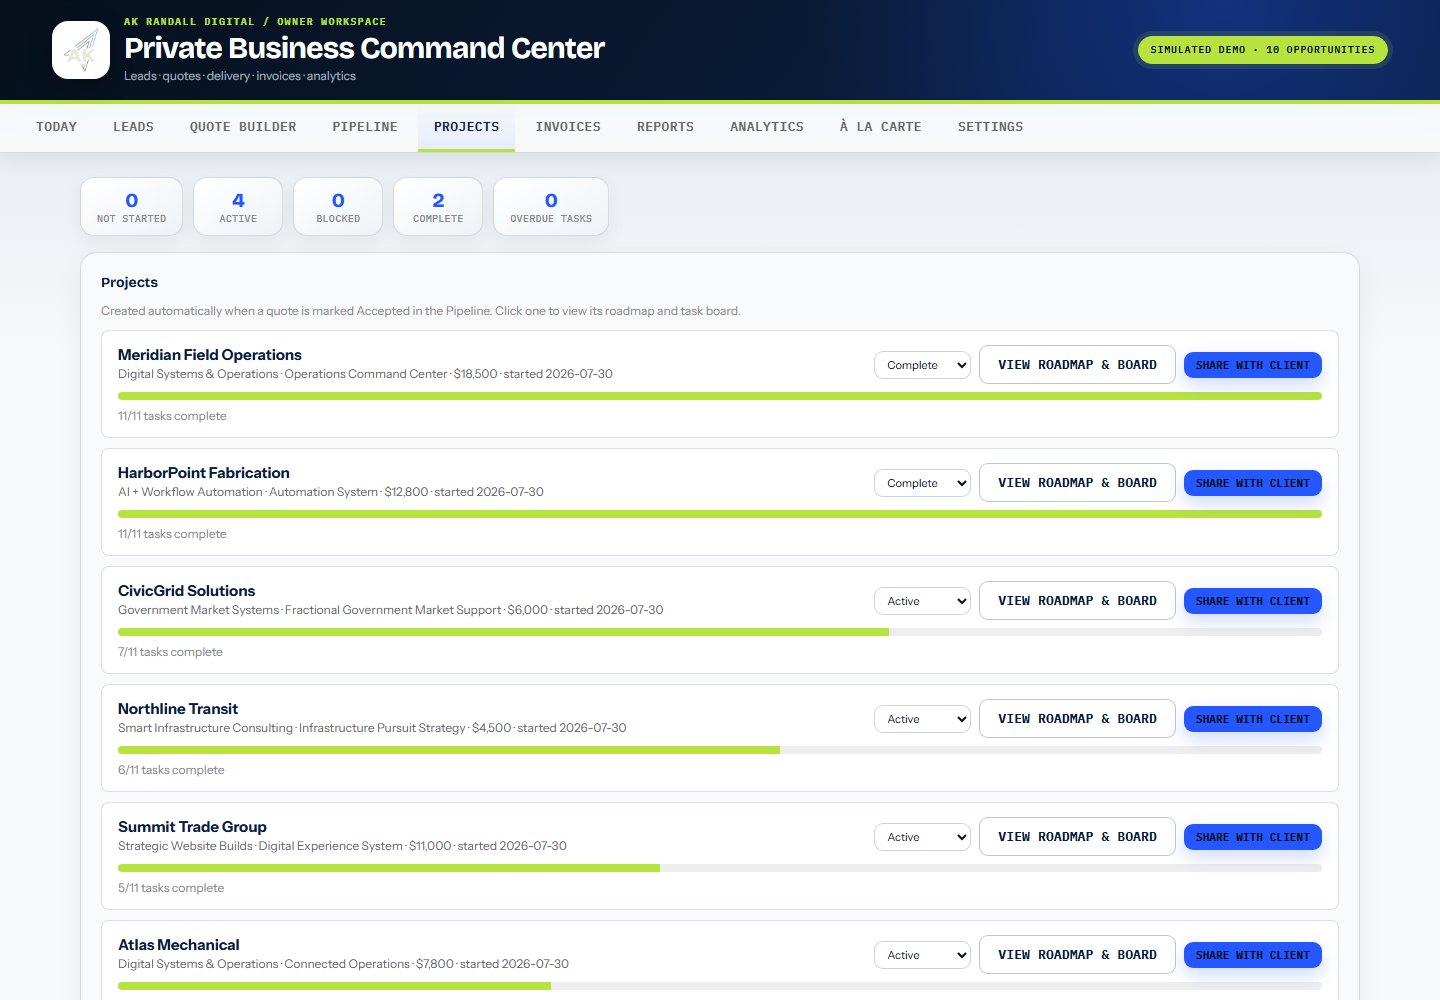
These are live interface captures using a complete fictional portfolio. The data is deliberately successful enough to demonstrate the reporting experience, while every view remains marked as simulated.
TODAYWhat needs attention now?
LEADSWho is this, and what happens next?
PRICECan this scope be delivered responsibly?
PIPELINEWhere is the next handoff?
DELIVERYWhat did the business promise?
REPORTWhat is the business learning?
ANALYTICSWhich customer actions are creating signal?
What the demonstration proves
See the potential clearly. Prove the real value with your data.
The fictional portfolio shows how a healthy operation can look when its information is connected. For your business, those demonstration records would be replaced with your workflow, goals, and approved data. Your starting measurements then become the point used to compare future improvement.
How to read the table: “Working feature” means the capability exists and was tested. “Result to track” is the business improvement to measure after the system begins using your real data.
AreaWorking featureResult to track
Lead handlingContact, source, sales stage, notes, and next follow-upTime to respond + percentage of leads that fit the business
PricingPromised work, service levels, delivery cost, expected profit, and available capacityDays from defined work to sent quote + expected profit after delivery cost
DeliveryAccepted quote connected to project, tasks, and invoiceTime from acceptance to project start + work finished on schedule
ManagementDaily priorities, reports, website activity, and backupsFollow-ups completed on time + expected revenue compared with actual revenue
Why this transfers
Your software may be different. Your handoff problem may be the same.
The value is not a specific screen or platform. It is the discipline of connecting signs of customer interest, pricing and sales decisions, promises made during the sale, project delivery, and lessons the business can use next.
Create one dependable record
Reduce the number of places someone has to search before they understand the customer, status, and next action.
Make qualification repeatable
Give the team shared criteria for what to pursue, what to pause, and what information is still missing.
Carry context into delivery
Connect the promise made during sales to the scope, tasks, owners, dates, and invoice that follow.
Use operations as business intelligence
Turn daily records into evidence about what is working, where work stalls, and what should change next.
A sellable business-management system
Built around the business—not dropped in as another disconnected app.
The command center is a working system that can be configured for service businesses, contractors, consultants, and growth teams that need a clearer path from a potential customer’s first signal to completed work.
Define the operating path
Map the lifecycle, records, stages, decisions, owners, and management questions the system must support.
Fit the commercial model
Adapt services, pricing logic, recurring work, projects, invoicing, reporting, and terminology to the way the business actually runs.
Bring in useful signals
Connect website leads, assessment context, approved imports, and other practical sources without forcing a full technology replacement.
Manage from evidence
Establish real baselines, review performance, and refine the workflow as the business learns where time, margin, and opportunities are being lost.
See your operation in one place
What should your command center make easier to see and act on?
Start with a free workflow-readiness check, or use a free 30-minute intro call to map the first version of your operating system.
Assess my workflow Book a free intro call